PHP 5.3 + XDebug + NetBeans + Mac OSX Leopard
… or how I got all the toys to play nice together …
If you’re working in PHP and are echoing out your variables to see what’s going on, please stop that right now. Graphical Debuggers are here (in fact, they’ve been here for some decades) and now they work really nicely with free IDE tools. Here I’ll outline how to get graphical PHP debugging with NetBeans working. The overview is: (1) install PHP 5.3, (2) install Xdebug, (3) install NetBeans, (4) configure publishing path, (5) test Xdebug.
There’s a lot more to go through. Click through to see all the steps…
PHP
OSX Leopard came installed with PHP 5.2. You can check by opening up terminal and typing php -v, or looking at the output of phpinfo(). I want the latest version of PHP which is currently 5.3.
First, you need to stop the old version of PHP from running. Edit httpd.conf with your favorite text editor. My choice: from the terminal, run sudo /etc/apache2/httpd.conf. The sudo is necessary since it’s a protected file. (You may find you need to set an account password). Find the line beginning with “LoadModule php5_module” and comment it out:
<span style="font-family: monospace;">#LoadModule php5_module libexec/apache2/libphp5.so</span>
Then, restart apache: sudo apachectl restart
Next, install the later version of PHP. Go to entropy.ch and download Entropy PHP 5.3.0-3.pkg. Open the package and follow the instructions. After this has completed, apache will be running with PHP 5.3.
If you care about this, your command line php interpreter will still be running an older version of PHP. Verify by comparing the output of php -i on the command line with phpinfo() from the web server. I found my 5.3 version of the CLI PHP at /usr/local/php5/bin/php. Also of note: some day you’ll need to know with total certainty which php.ini file is being loaded. You’ll see this from these outputs.
XDebug
Roll up your sleeves. It’s time to get a bit hacky.
There’s a few ways to install xdebug – build from source, install with PEAR, or find a precompiled binary to install. I pick the latter. The fine folks at ActiveState have a package with precompiled xdebug modules for lots of PHP versions. Here’s the download I grabbed. Extract the files and copy the <komodo_files>/5.3/xdebug.so into /usr/local/php5/lib/php/extensions/no-debug-non-zts-20090626. If you’re in the terminal, cd to the extracted 5.3 folder and type in sudo cp xdebug.so /usr/local/php5/lib/php/extensions/no-debug-non-zts-20090626.
At the end of your php.ini file, add the following lines to enable and configure xdebug:
[xdebug]
zend_extension="/usr/local/php5/lib/php/extensions/no-debug-non-zts-20090626/xdebug.so"
xdebug.remote_enable=on
xdebug.remote_handler=dbgp
xdebug.remote_mode=req
xdebug.remote_host=localhost
xdebug.remote_port=9000
xdebug.idekey="netbeans-xdebug"
xdebug.remote_log="/var/log/apache2/xdebug_remote.log"
Restart apache again. Look at the output from phpinfo and at the end of the first block you should now see “with Xdebug v2.1.0beta3, Copyright © 2002-2010, by Derick Rethans” in the copyright. If you see this, Xdebug is installed. If you can’t see this, something didn’t work. Make sure you edited the correct php.ini file, and make sure you restarted apache.
NetBeans
Go to the NetBeans download page, and pick the most relevant version. If you’re doing PHP programming, start out with the PHP version. Download and install like any other app.
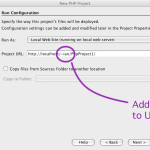 Create a new “PHP Application” NetBeans project. Use the defaults on the first page, and make sure that PHP 5.3 is selected on the second page. On the third page, make the URL point to your personal local page – insert a tilde followed by your username.
Accept all the default options on the final dialog page and get into the editor.
Next, add some code to get things rolling. I opened the default index.php and added some basic stuff in there.
<!DOCTYPE HTML PUBLIC "-//W3C//DTD HTML 4.01 Transitional//EN">
<html>
    <head>
        <meta http-equiv="Content-Type" content="text/html; charset=UTF-8">
        <title></title>
    </head>
    <body>
        <?php
        // put your code here
        $test = 3;

        while ($test > 0) {
            $output = $test . "...<br>";
            echo $output;
            $test--;
        }

        xdebug_break();

        echo "Go!<br>";

        ?>
    </body>
</html>
Almost time to test it out – the only thing remaining is to get the source tree into view of apache. For my username, the /Users/Ian/Sites/ folder is published as http://localhost/~ian/. The most direct way I’ve found to test and develop is to symlink from this folder to your project sources folder, thus:
cd /Users/Ian/Sites/
ln -s ~Ian/NetBeansProjects/PhpProject1 PhpProject1
Finally, apache is configured to not follow symlinks. I made two changes to make to enable this: in /etc/apache2/Users/Ian.conf I changed the AllowOverride directive to read “AllowOverride All”. Then in ~/Sites/htaccess I added “Options +FollowSymLinks”
Now go back to NetBeans and run the project (press F6, or click the  button). You should see the countdown in your browser.
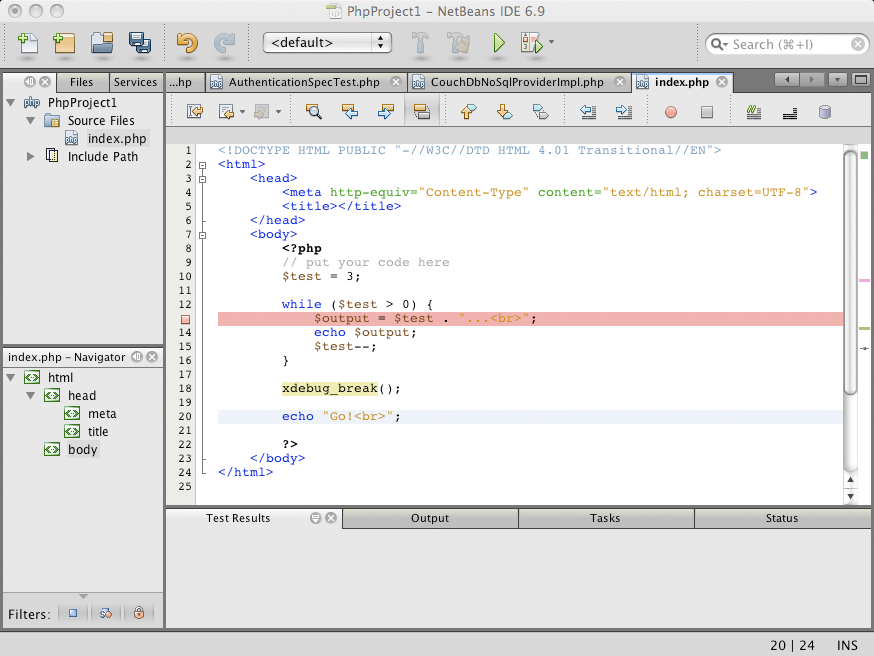 Finally, make sure Xdebug is all set up properly and working. Set some breakpoints in the code: look at the screenshot and you’ll see that on line 13 I set a breakpoint in the IDE (just by clicking the where the red square is, or by pressing Command+F8). Also on line 18 there’s a call to
 xdebug_break(), which will have the same effect as the IDE breakpoint. Also to note, by default NetBeans will break on the first line of the script (you can change this behavior in the PHP / General section of the NetBeans Preferences).
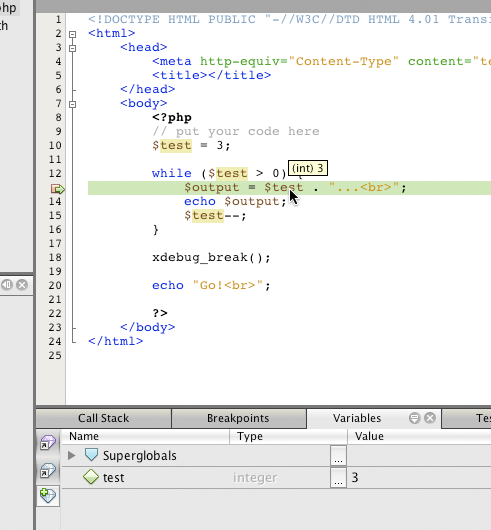 From the Debug menu, choose Debug Project. A browser window will open up, and if everything is set up correctly, that window will show absolutely nothing. What you should see in the NetBeans window is the green arrow and highlight at line 8, indicating this is the next line to execute. From the Debug menu press Continue – the execution pointer will jump down to line 13 (where you set the breakpoint). In the source window click on the
 $test variable name, and leave the mouse pointer over the word. A small popup shows you the current value of the variable. Alternatively, look at the Variables window, and see the values of the variables in scope. Click Continue again, and notice the value of $test changes to 2, and then to 1. Clicking Continue again will pause execution at the xdebug_break() call.
If Xdebug isn’t working, the config settings (in php.ini) are definitely very picky. I’ve found different platforms and versions don’t work exactly the same, so play around with those settings. Make sure you restart apache each time you make a change, otherwise nothing will happen. Make sure you’re editing the correct php.ini – many fist-to-forehead injuries have been caused (to me) as a result of not doing this.
That’s it. Play with the Step Into and Step Out Of debugging commands to dig down into and back out of functions. Also check out the Xdebug documentation – there’s a great API for debugging, tracing and profiling.